
It is well known that views on social issues are influenced by demographics. Whether similar people agree or dissimilar people disagree on touchy topics are useful insights that social science articles point to. These insights remain “internal” to the system, so to speak. In this work, using data from a Bentley–Gallup survey and the martingale mathematics of e-values, we showcase how someone “external” to the system could exploit these insights to build up a huge fortune. We achieve this through two parts. First, by showing the internal predictability will help (that is, if, for instance, similar people agree, that it is useful knowledge, as is if similar people predictably disagree). Second, by analyzing the aggressiveness or conservativeness of the “external” better (how much of the current wealth should they bet on the next issue/question) which has got nothing to do with whether similar people agree, that is, with the previous part. We recommend certain optimal ways to bet, with and without demographic knowledge of the participants.
Imagine having to build up a fortune – or lose one – based on rightly or wrongly predicting whether two people will agree on some issues pressing to society. Whether you would agree to be part of the scheme could depend on many factors. The types of issues being discussed (which political party should be in power is more divisive than whether we would need oxygen to live) or how many issues we are talking about. And if you do agree to play, how you will place your bets could depend on a further set of factors. Some external, like the two people that are being interviewed for possible agreement, and some internal, like how aggressively or conservatively you would want to bet (that is, how much of your current capital are you willing to put on stake). Amidst a charged political climate where disagreements are more common than ever, such games bring out strategies that, frivolously, help people amplify their capital, but more seriously, point to strange structures of society that might have gone, otherwise, unnoticed. And there are tools. Take the social survey that Bentley University did in collaboration with Gallup and made available to its students and faculty: 128 questions were asked, nearly all around how modern businesses function or ought to function, and demographic details of the respondents, along with political leanings were stored. It may be vital to query, as people become more and more similar, whether we can bet confidently on their agreement, or as they become more and more dissimilar, on their disagreement – and end up becoming rich. Martingales – some structures from probability theory – furnish useful answers. But first, some background!
Storms in (eight) teacups
Tales of odd coincidences, no matter how repeated, seldom cease to thrall. The setting for one was a tea party in full swing. 1935. Central London. Sir Ronald Fisher, already a well-known statistical figure, was in attendance. So was Dr. Muriel Bristol, one of his colleagues, less known. Fisher invited Muriel to join him for tea. Muriel declined, citing he was pouring tea first and then milk, while she liked it the other way. And she could tell just by tasting. Stunned, Fisher decided to test whether Muriel was bluffing. Promptly, out were laid eight cups, four with milk first, and four with tea, that looked rather similar. Muriel was invited to take sips and guess the order of composition. Now this invitation she accepted! And came off with flying colors. Each cup was rightly decoded! Much of this is the substance of Fisher’s randomized trials, books and cinema that later succeeded commercially (David Salsburg’s The Lady Tasting Tea), but in all seriousness, it points out a nagging inadequacy, an ineffectiveness of a way of thinking – an unfairness – that the contemporary statistical community is bent on distancing itself from.
It has to do with probabilities. In case Muriel was truly bluffing, what are the chances she could have rightly predicted each cup just by chance? Quite remote. 1 out of 70, in fact. This is because Fisher could have chosen the four spots out of eight for the milk-first cups in ways. And if Muriel were really bluffing – she was told it would be half and half (the order profile that is, not the milk – that is a pun courtesy of a colleague who was heckling me while I was giving a talk) – all of these 70 arrangements would have been equally likely to her. Hence, the chances of getting that specific arrangement – the right one – would have been 1/70 or 0.01428, the -value in today’s language (with Fisher’s null being she is bluffing), which is less than our usual 5% or 10% levels of significance. This, to Muriel, is a sweet ending because Fisher gives up his null claim and recognizes her tasting prowess.
Troubles begin if Muriel somehow got at most one wrong. The hostile statistical environment she had to perform under would have begun to show. The probability that a chance guess would trigger at most one error is (argue how) – inflating the -value, making Fisher more prone to saying the order-detection is impossible, even though she did extremely well, getting the majority right.
Betting – the thrill of backing up your guess with some form of capital – rectifies this problem, summoning a fairness, through allowing Muriel not just voice her decision, but reveal how confident she feels in her verdict. Imagine Fisher conducting the experiment as a sequence, each time tossing a coin: if it lands head, he prepares , if tails, . Muriel, starting with an initial wealth of $1, is expected to bet on the outcome of the toss. Table 1 describes the details.
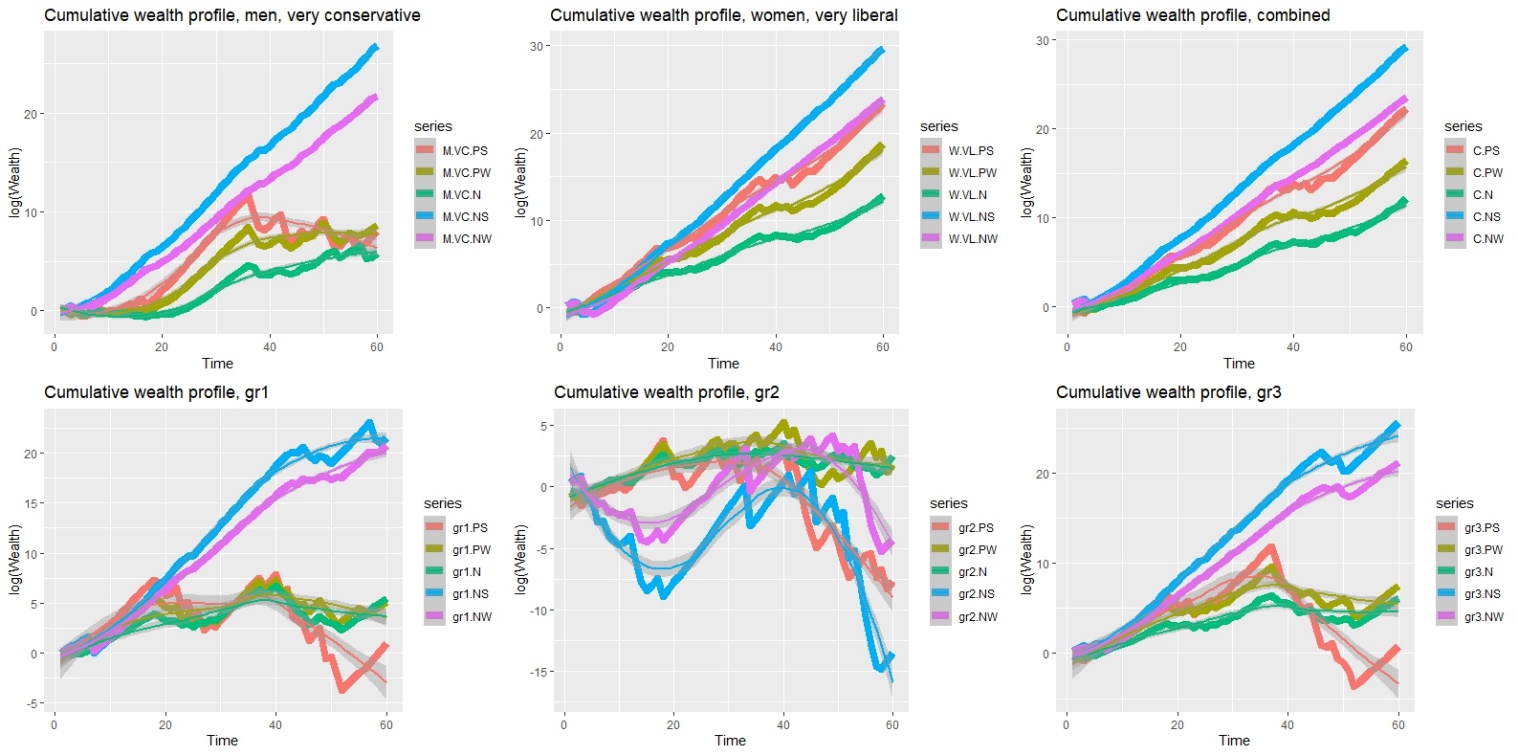
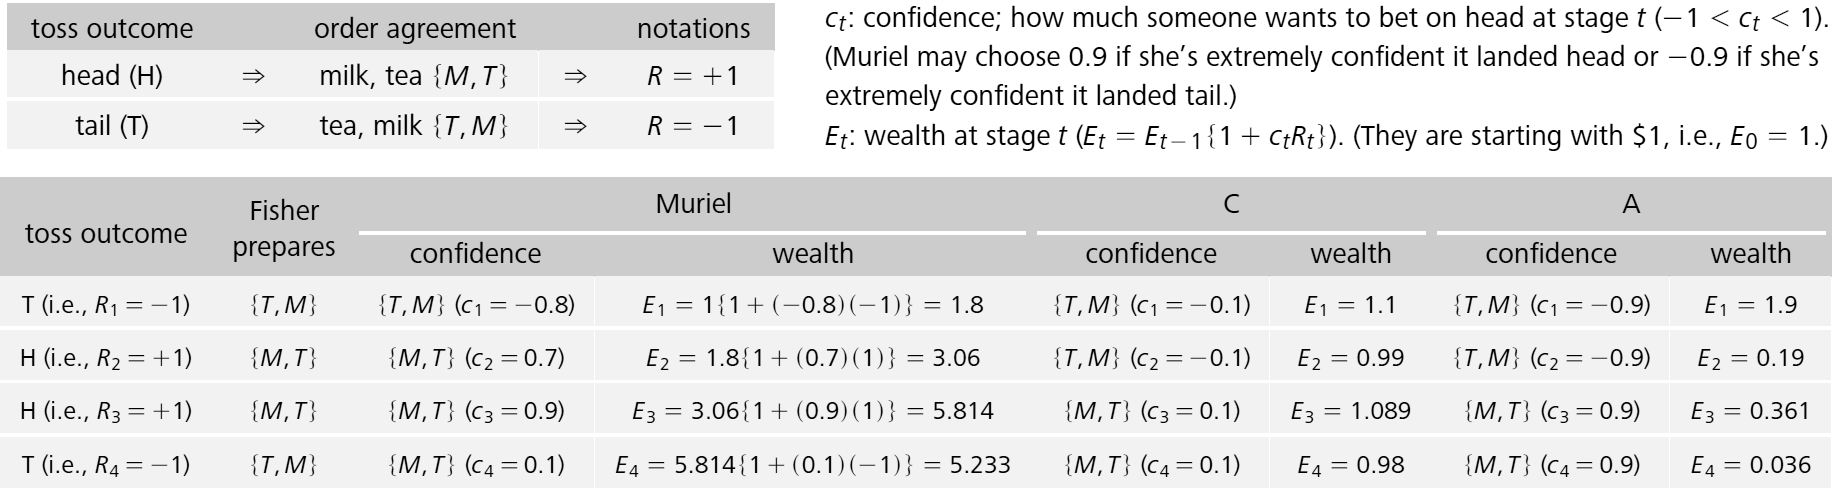
Table 1. Players’ wealth evolution. The players: (1) The truly great taster Muriel, (2) a person “C” who bluffs, but bluffs cautiously, and (3) a person “A” who bluffs, but bluffs aggressively.
The chief idea is this: if Muriel is bluffing, it would be nearly impossible for her to accumulate a huge fortune through random guessing. A running record of Muriel’s wealth, then, would offer another way to test Fisher’s hypothesis, only this time leveling the playing field somewhat (see the table above).
The storms spread beyond teacups
Eerily, you will find parallels everywhere. Rightly viewed, many statistical tasks we are routinely pitted against may morph into Murielesque prophecies. Predicting whether or not two respondents on the Gallup survey will agree (that is, both will respond with a 1 or a 2 or a 3 or a 4) on social issues such as whether businesses should prioritize increasing profits each year, or reduce the wage gap between executives and ordinary employees (a long list in [2 M. Bhaduri, Do we let businesses get away with dodgy ethics and loose morals? An application of Markov random fields. Chance (N. Y.) 37, 6–12 (2024) , 6 B. Zahirodini and M. Bhaduri, Pyramids of priorities and a poisoned omen: differing hierarchies of desired business ethics. Nightingale (2024) https://nightingaledvs.com/pyramids-of-priorities/, 8 B. Zahirodini and M. Bhaduri, Marking contemporary America’s attitudinal stance toward modern businesses: a Bayesian attempt to detect deviation patterns based on demographics and politics. Chance (N. Y.) 38, 52–62 (2025) ]) may be seen as predicting the order of drink preparation (an observed agreement will, for instance, correspond to Fisher putting tea first). Guessers may want to build up a fortune through these games of predicting agreements and disagreements, instead of the one about predicting milk and tea.
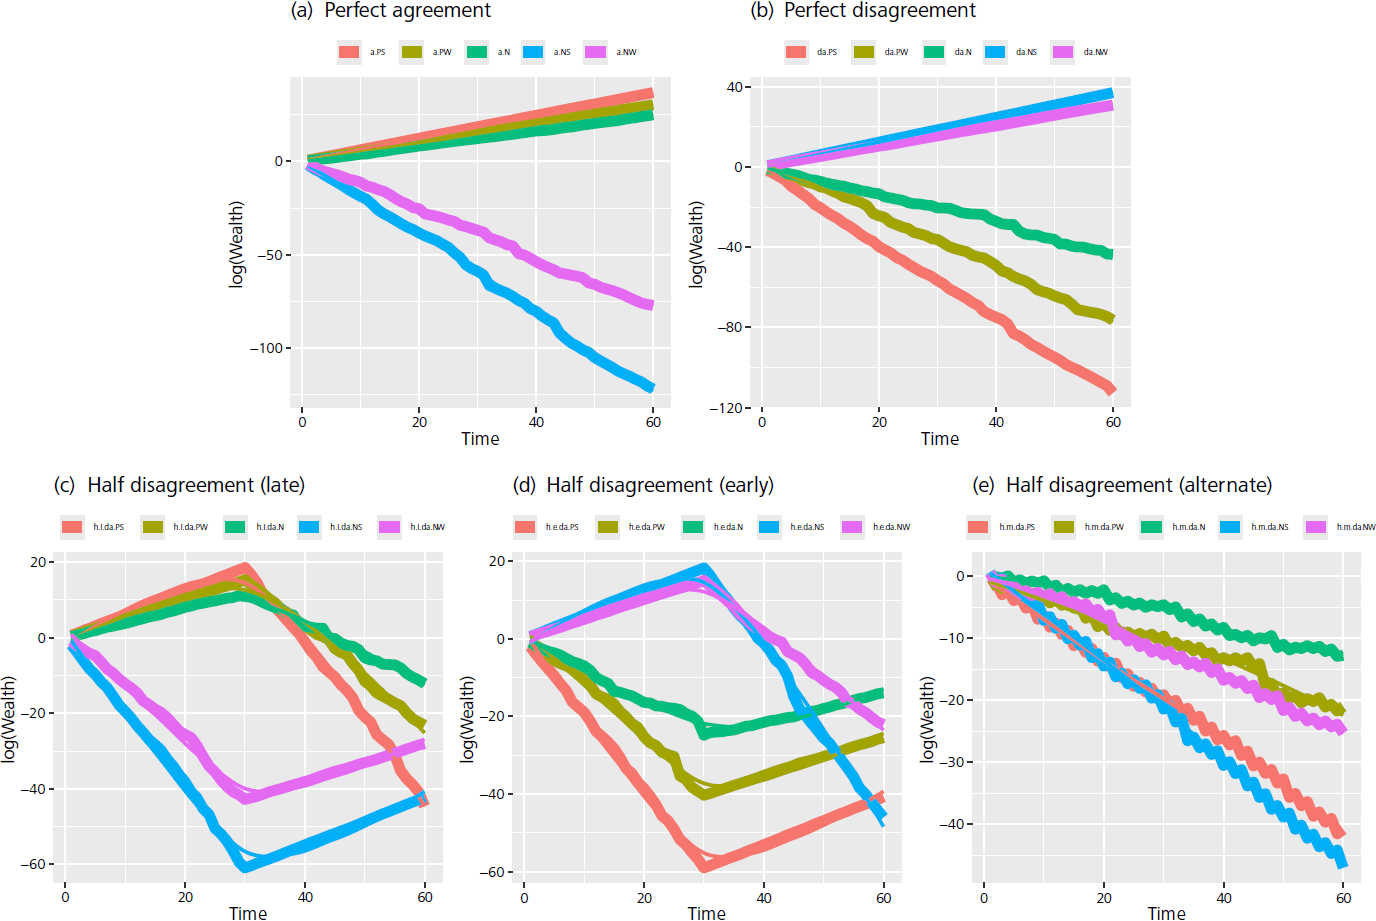
With each question playing the role of a cup (we look at sixty questions here: the 11, 12, 13, 14 and 23 series detailed in [2 M. Bhaduri, Do we let businesses get away with dodgy ethics and loose morals? An application of Markov random fields. Chance (N. Y.) 37, 6–12 (2024) , 3 M. Bhaduri and B. Zahirodini, How businesses function. Podcast Stats + Stories, Episode 346 (2024) https://statsandstories.net/economics1/how-businesses-function, 7 B. Zahirodini and M. Bhaduri, The stuff we cannot sweep under a torn carpet: perfectly imperfect tessellations from slices of Maslow’s triangle. Nightingale (2024) https://nightingaledvs.com/the-stuff-we-cannot-sweep/, 8 B. Zahirodini and M. Bhaduri, Marking contemporary America’s attitudinal stance toward modern businesses: a Bayesian attempt to detect deviation patterns based on demographics and politics. Chance (N. Y.) 38, 52–62 (2025) ]), Figures 1 and 2 document (on a logged scale) the evolution of wealth as issues change. Skill and attitude are two organic imperatives that drive these evolutions. If the guessers are skilled (that is, can rightly predict agreements or disagreements), their wealth will increase (that is, the “” term in Table 1 will be positive) and if they are aggressive (that is if they put a lot at stake, that is, Cs are higher in magnitude) their wealth will get updated by huge amounts.
To test our intuitions, were erect five hypothetical guessers:
who strongly (with more than 0.7) believes that two individuals would agree,
who weakly (with more than 0.35) believes that the two individuals would agree,
who is neutrally positive and is unwilling to pick a side,
who weakly (with less than ) believes the two individuals would disagree,
who strongly (with less than ) believes that the two individuals would disagree,
and task each of them with predicting the agreement pattern under:
(shown in Figure 1(a)): where the two people being checked for possible agreement are the same person (we took this to be the first person on the survey, but this can be anybody).
(shown in Figure 1(b)): where one never – not even once on the set of sixty questions – says what the other says.
Clearly, given case (i), that is, under the knowledge of perfect agreement (one, by definition, will agree with oneself consistently), the “P”-category guessers will seem to be the most skilled and among them, “PS” should amass the larger fortune, while the “N”s will seem to be unskilled and “NS” will suffer more. Figure 1(a) confirms this. The situation, expectedly, reverses perfectly under case (ii), when strongly saying people will disagree will be the most profitable (Figure 1(b)). Panels (c), (d), and (e) showcase the scenario when they agree only half the times and when that half happens. These are expected too.
On the fuller survey data, we extend this analysis and ask, for instance, if we knew the two people have similar demographic (similar gender, income, age, education, etc.) or political details, should we bet strongly that they would agree on these social issues? Or, if they have differing details, then bet strongly that they would disagree? However many details we record, there will generally be many individuals with these properties. Many pairs may, therefore, be formed (this did not happen in cases (i) or (ii) above, where, in each case, we had two people, and hence, just one pair). Depending on how we choose to form the pairs, we install the following sampling schemes:
when the two people picked surely have the same details (for instance, both are surely men, or both are surely women, if we are considering just one detail: gender).
when they surely have different details (surely one is a man, the other, a woman).
when they may or may not have the same details (they could both be men, or both women, or one a man and the other a woman).
We add a general guesser whose confidence on any guess never goes beyond the limit . If the gap between and increases, the guesser becomes chaotic (potentially changing his attitude a lot across the sequence), if it decreases, their attitudes become more stable. For instance, .
A line on Figure 2, at any time, represents the average wealth accumulated across comparing all possible pairs of people up to that point in time, according to that sampling-guesser profile (trend lines and confidence intervals are supplied for easier visualisation). The requirement that people should be similar across many demographic and political details (instead of a few) necessarily offers fewer potential pairs that may be formed for possible opinion agreement. This explains why the lines in the lower row on Figure 2 are more volatile than those in the first.
Generally, we may have felt that given that two people share similar details, the better who bets on their agreement (i.e., the ones) will accumulate wealth and those that bet aggressively will accumulate more wealth. While this is true when the two are sampled from some sections of the population, at least initially – for instance, when both are very liberal women (Figure 2) – this is not the case in general, for instance, for very conservative-leaning men.
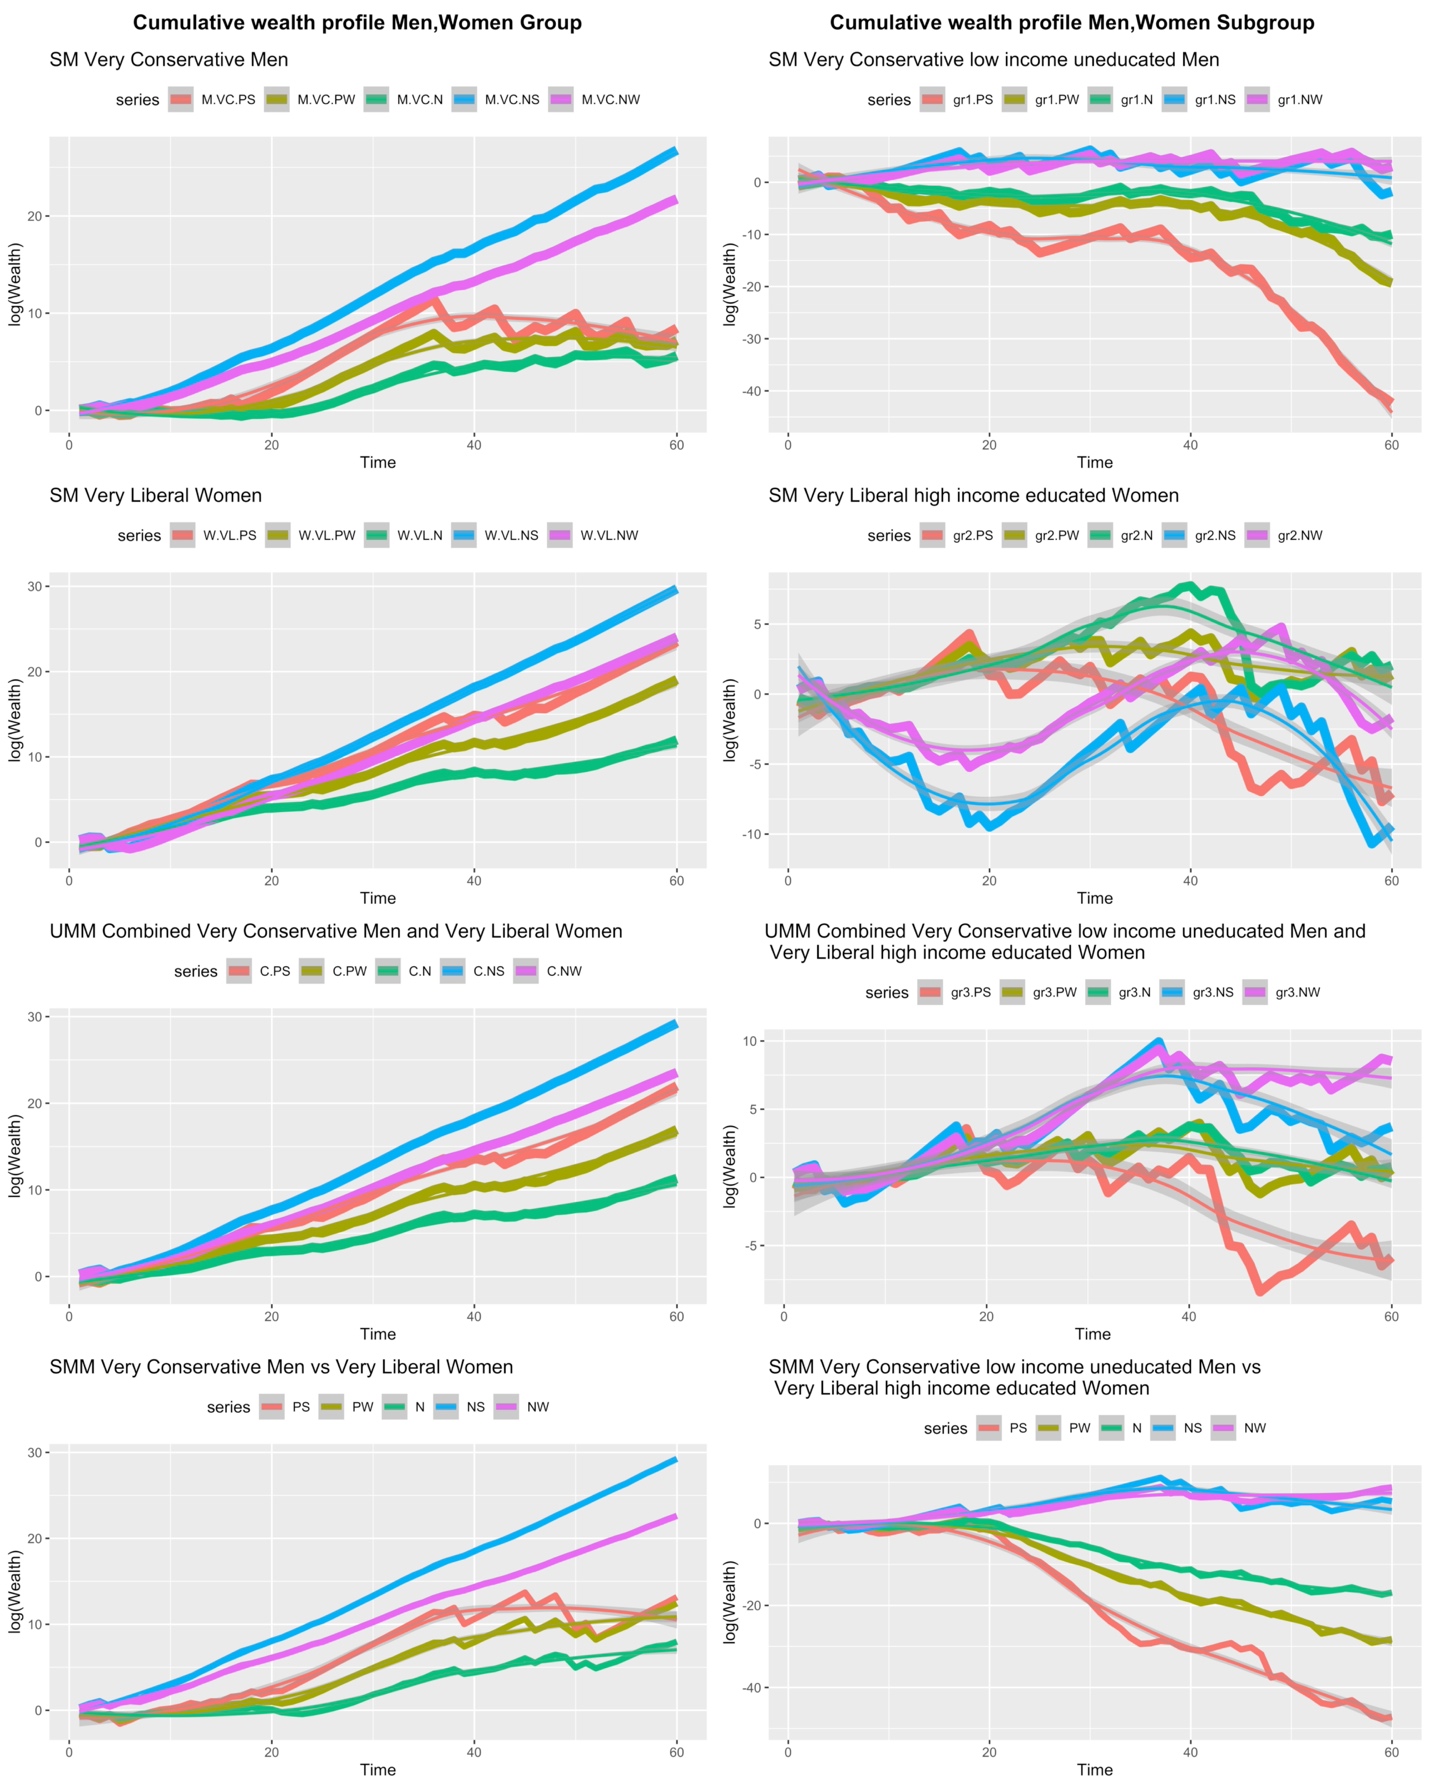
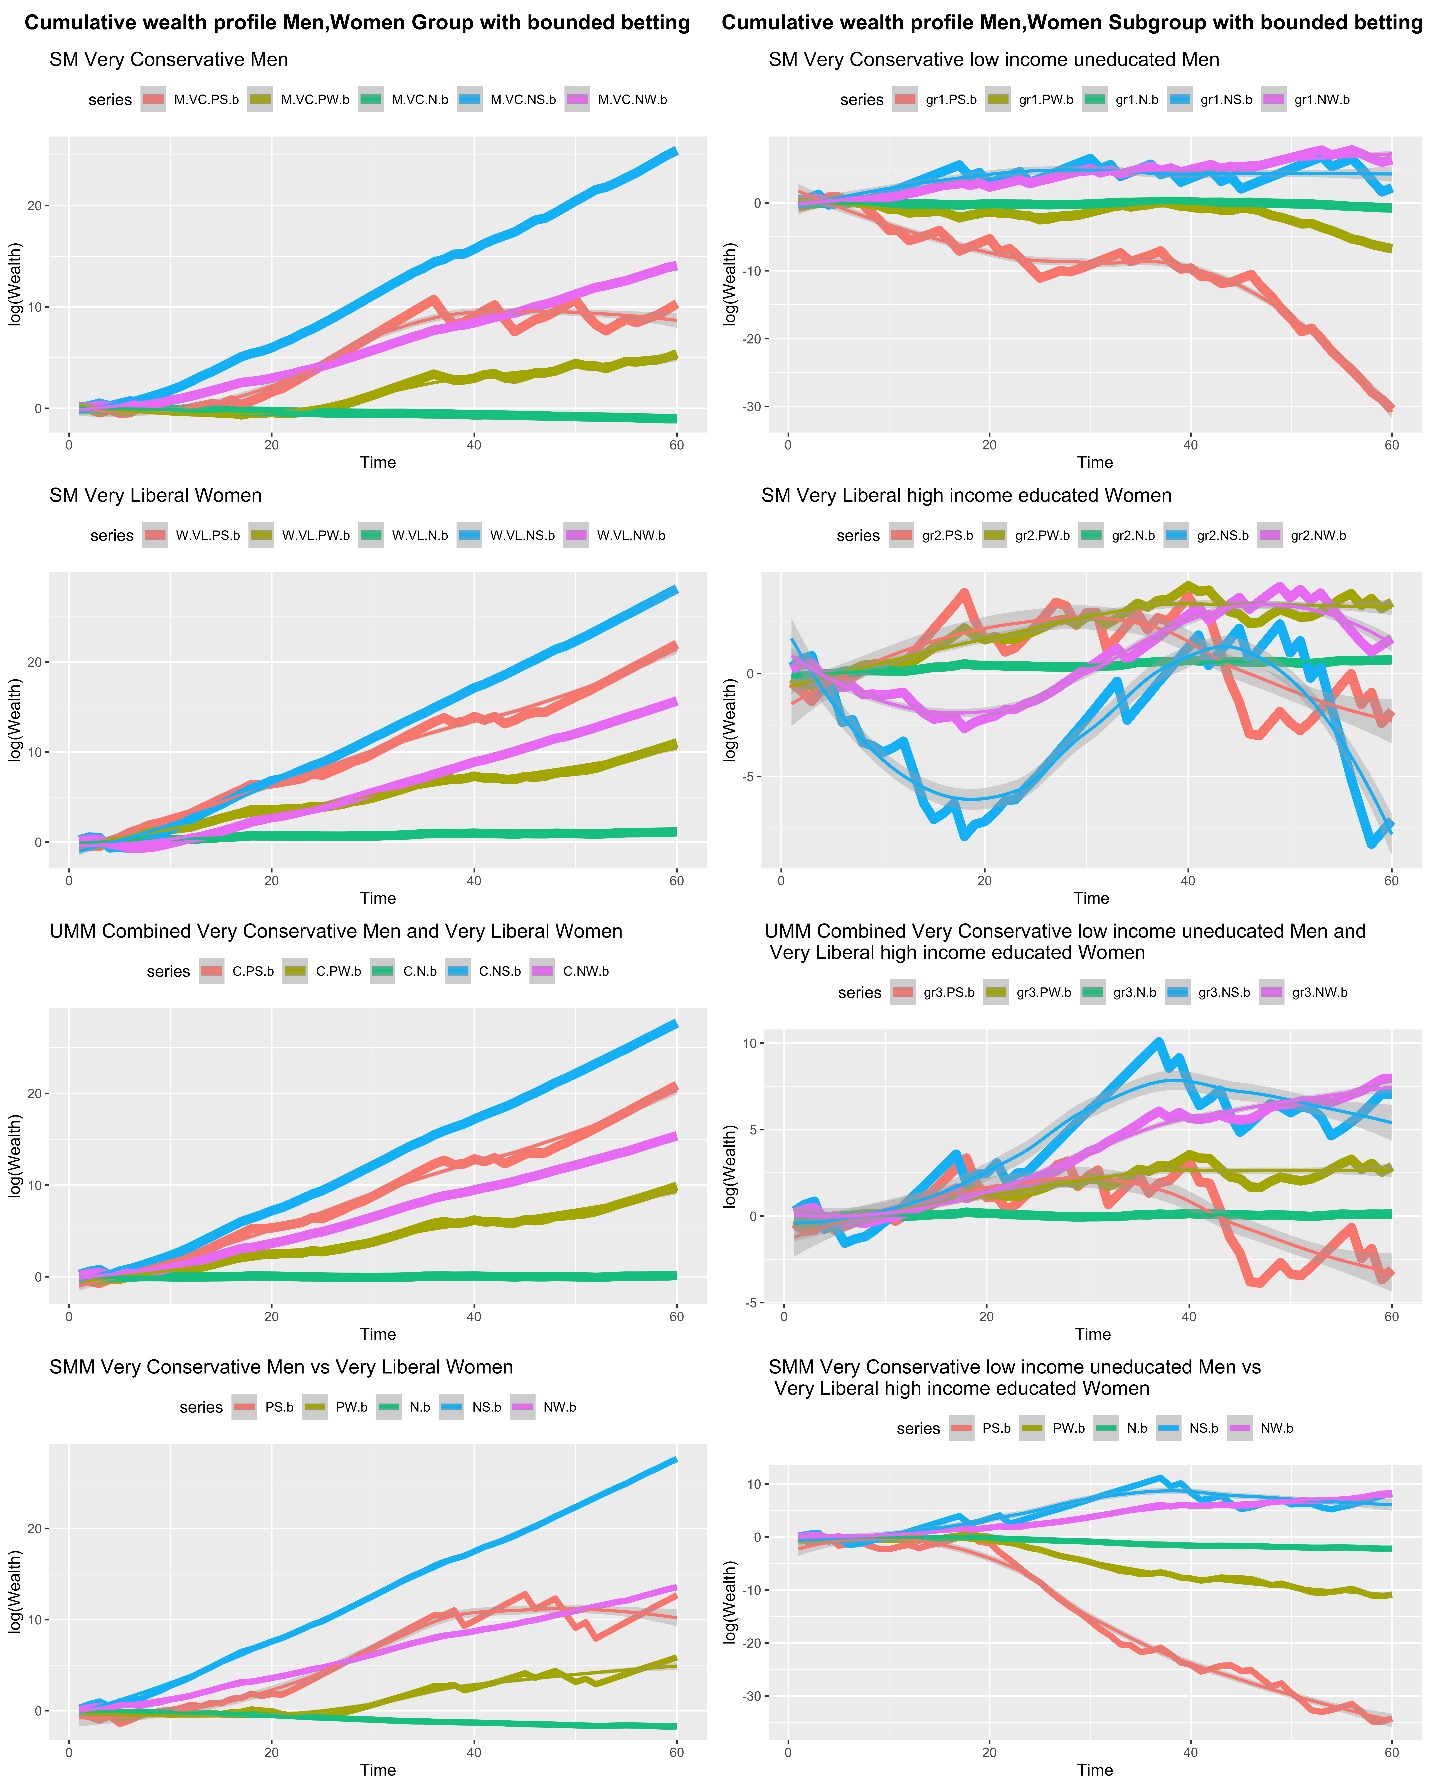
Figures 3 and 4 invite parameters such as income and education, in addition to gender and politics (under any mismatch scheme – UMM or SMM – we have sampled individuals from the extremes of these demographic axes to mimic the possibility of being maximally incongruous) under the chaotic (Figure 3) and more stable (Figure 4) betting attitudes (with an - range of 0.2). This attitude does not influence the way of wealth accumulation for certain groups (for instance, SMs for very conservative, low income, uneducated men, row 1, column 2, Figures 3 and 4), while it does for some others (for instance, SMs for very liberal, high income, educated women, row 2, column 2, Figures 3 and 4). The amounts of wealth variations, however, differ, even for the groups where the patterns and order of the five colors stay the same. Thus, for instance, saying very strongly that two very conservative, low income, uneducated men will keep agreeing will be a recipe for losing money. But one would lose more money ( on the log-wealth scale) under the chaotic scheme (betting 0.7 of the current capital on one question, 0.98 on the next) than ( on the log-wealth scale) under the stabler scheme (betting 0.7 of the current capital on one question, 0.75 on the next), for instance.
Under minimal background knowledge (Figures 3 and 4, column 1), nearly every strategy will inflate wealth as long as one consistently sticks to the strategy, although the amount of inflation would vary. As many details get revealed, frequently, we find results one may expect. While contrasting very different individuals (rows 3 and 4, column 2, Figures 3 and 4), betting (strongly or weakly) that they will disagree will be profitable in the long run. However, the opposite need not be true. With two people that are very similar, strongly betting on their agreement need not be prudent forever (rows 1 and 2, column 2, Figures 3 and 4). Neutrality may be recommended at these times.
In most of the examples we have documented, at least on the larger-sized combinations (that is where many pairs could have been formed, that is, on the lines with lower volatilities) the blue NS lines stay, generally, on top. Thus, if we are not sure of the nature of the people whose agreement is being questioned, betting strongly that they would disagree seems to be a sure way of accumulating wealth. How much will be accumulated, however, depends on the people being compared and the way of comparing. There are other benefits to tracking the evolution this way instead of simply reporting the final wealth. Figures 1(c) and 1(d), for instance, show how the ultimate wealth state (and the amount of fluctuations) could be similar, but the way to reach that state could be quite different. On nearly each diagram on Figures 2, 3 and 4 made with the real survey data, we note structural shifts around question 40 (with this specific order of querying), signaling the onset of a group of touchy issues and divisive questions that alter substantially the ongoing pattern of wealth accumulation – whether good or bad – fracturing a neat predictability.
People have checked whether two jury members would agree (a judge, for instance, may be interested in that).1https://plaintiffmagazine.com/recent-issues/item/the-effect-of-jury-size-on-trial-outcomes
The “fortune” may not literally represent money, but some other version of capital: how long would the trial last, how long would a relationship thrive (between two people as long as they continue to agree on certain key things, between a researcher and a research topic as long as the researcher agrees on the interestingness of the topic). Basically, as long as guessing the agreement between two sides is of interest, all of this will go through. Or it could be literal money too. There is something called “bet-on agreement” that is similar.2https://www.investorinsights.asia/post/what-is-a-valuation-adjustment-mechanism-vam-bet-on-agreement
For relevant subtleties on gambling over public opinion, we point interested readers to [1 D. Basak and J. Deb, Gambling over public opinion. Am. Econ. Rev. 110, 3492–3521 (2020) ]. Other authors have looked at the effect of demographic factors on betting tendencies too, in other ways, for other ends [4 S. Castrén, J. Kontto, H. Alho and A. H. Salonen, The relationship between gambling expenditure, socio-demographics, health-related correlates and gambling behaviour—a cross-sectional population-based survey in Finland. Addiction 113, 91–106 (2018) , 5 T. A. Latvala, T. P. Lintonen, M. Browne, M. Rockloff and A. H. Salonen, Social disadvantage and gambling severity: a population-based study with register-linkage. Eur. J. Public Health 31, 1217–1223 (2021) ].
You may not care much about betting. For frittering away time and money on pointlessly risky pursuits (How to Gamble If You Must may be a good read). Still, these line diagrams, through their ability of revealing the wealth you could have accrued, of pointing, more vitally, to deeper cracks in the societies’ thought patterns, of showcasing fluctuating fortunes and other ramifications that result, become momentarily worth watching.
AI statement
The authors declare that no artificial intelligence was used either in the analysis behind or the writing of this manuscript.
Acknowledgements. This work was supported, in part, by the Research Enhancement Grant awarded to the second author by the American Mathematical Society and the Simons Foundation for the 2024–2027 cycle. Bentley University’s summer research grant, the support from its Faculty Affair’s Committee, Research Council and Provost’s Office are also gratefully acknowledged.
Dashboards for details and subtleties
https://statsandstories.net/economics1/how-businesses-function
additional material: https://doi.org/10.6084/m9.figshare.29882372.v1
- 1
https://plaintiffmagazine.com/recent-issues/item/the-effect-of-jury-size-on-trial-outcomes
- 2
https://www.investorinsights.asia/post/what-is-a-valuation-adjustment-mechanism-vam-bet-on-agreement
References
- D. Basak and J. Deb, Gambling over public opinion. Am. Econ. Rev. 110, 3492–3521 (2020)
- M. Bhaduri, Do we let businesses get away with dodgy ethics and loose morals? An application of Markov random fields. Chance (N. Y.) 37, 6–12 (2024)
- M. Bhaduri and B. Zahirodini, How businesses function. Podcast Stats + Stories, Episode 346 (2024) https://statsandstories.net/economics1/how-businesses-function
- S. Castrén, J. Kontto, H. Alho and A. H. Salonen, The relationship between gambling expenditure, socio-demographics, health-related correlates and gambling behaviour—a cross-sectional population-based survey in Finland. Addiction 113, 91–106 (2018)
- T. A. Latvala, T. P. Lintonen, M. Browne, M. Rockloff and A. H. Salonen, Social disadvantage and gambling severity: a population-based study with register-linkage. Eur. J. Public Health 31, 1217–1223 (2021)
- B. Zahirodini and M. Bhaduri, Pyramids of priorities and a poisoned omen: differing hierarchies of desired business ethics. Nightingale (2024) https://nightingaledvs.com/pyramids-of-priorities/
- B. Zahirodini and M. Bhaduri, The stuff we cannot sweep under a torn carpet: perfectly imperfect tessellations from slices of Maslow’s triangle. Nightingale (2024) https://nightingaledvs.com/the-stuff-we-cannot-sweep/
- B. Zahirodini and M. Bhaduri, Marking contemporary America’s attitudinal stance toward modern businesses: a Bayesian attempt to detect deviation patterns based on demographics and politics. Chance (N. Y.) 38, 52–62 (2025)
Cite this article
Bahareh Zahirodini, Moinak Bhaduri, Are all bets off when it comes to agreement gambles?. Eur. Math. Soc. Mag. 139 (2026), pp. 26–32
DOI 10.4171/MAG/294